Data Collection
Our pipeline automatically downloads WASDE reports from the USDA archive and scrapes real-time economic calendar data. Historical price data is fetched for all 15+ monitored instruments, including corn, wheat, soybeans, crude oil, natural gas, S&P 500, and 10-year bonds.
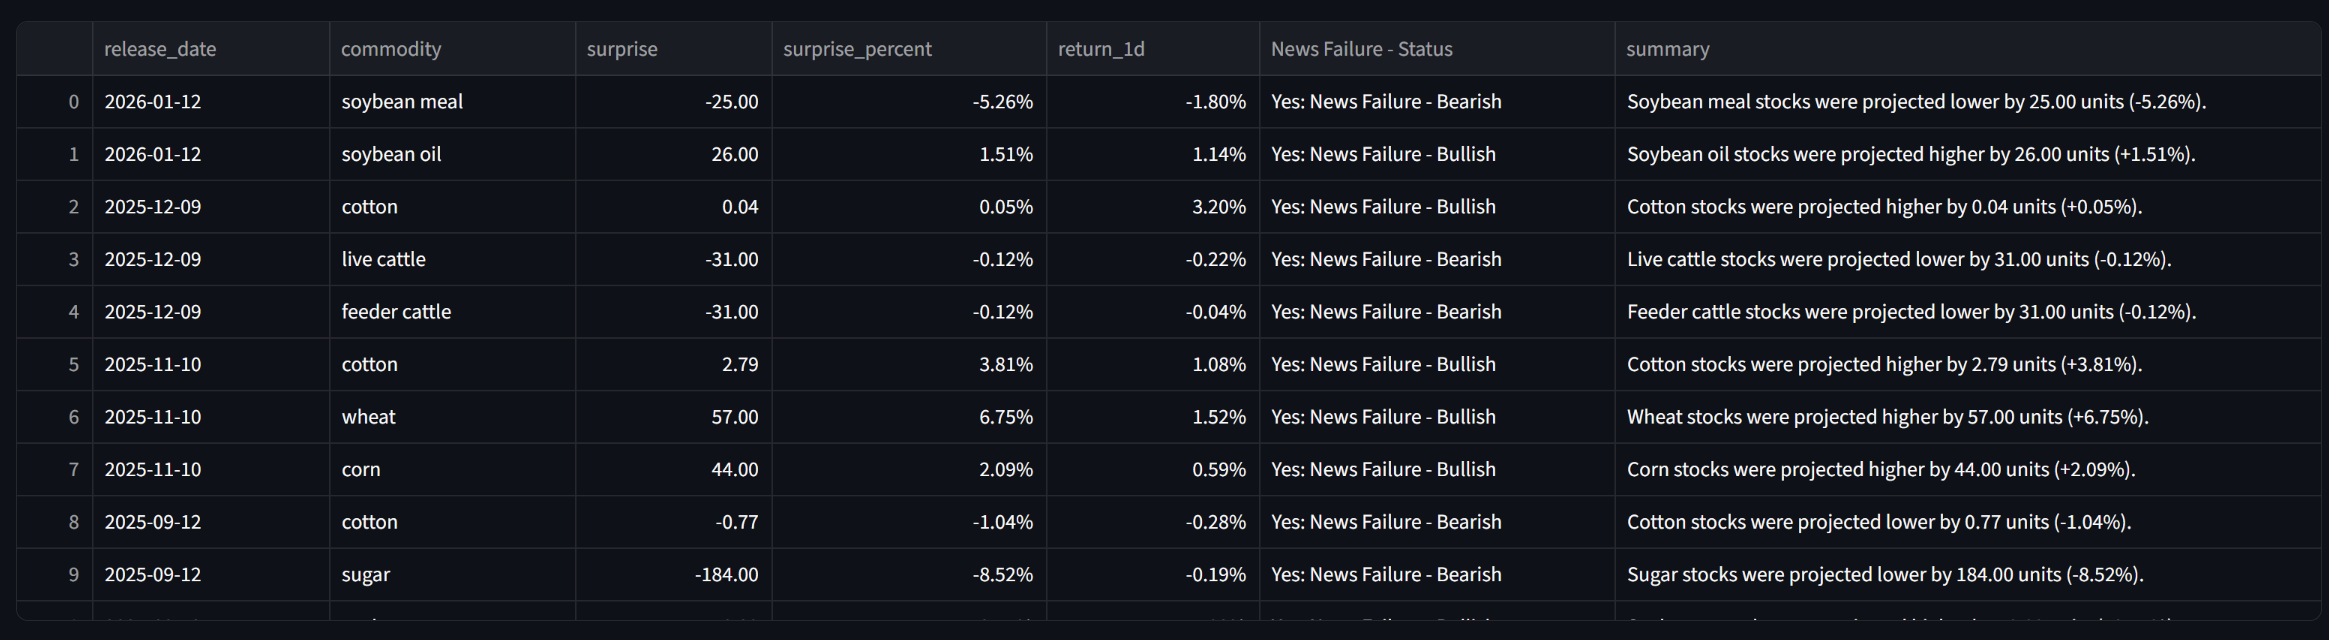
Report Parsing & Surprise Calculation
WASDE data files are parsed to extract ending stock projections for each commodity. The system compares the current month's projection against last month's to calculate the surprise. For economic events, actual values are compared against consensus forecasts. A surprise direction (bullish or bearish) is assigned using instrument-specific sentiment rules.
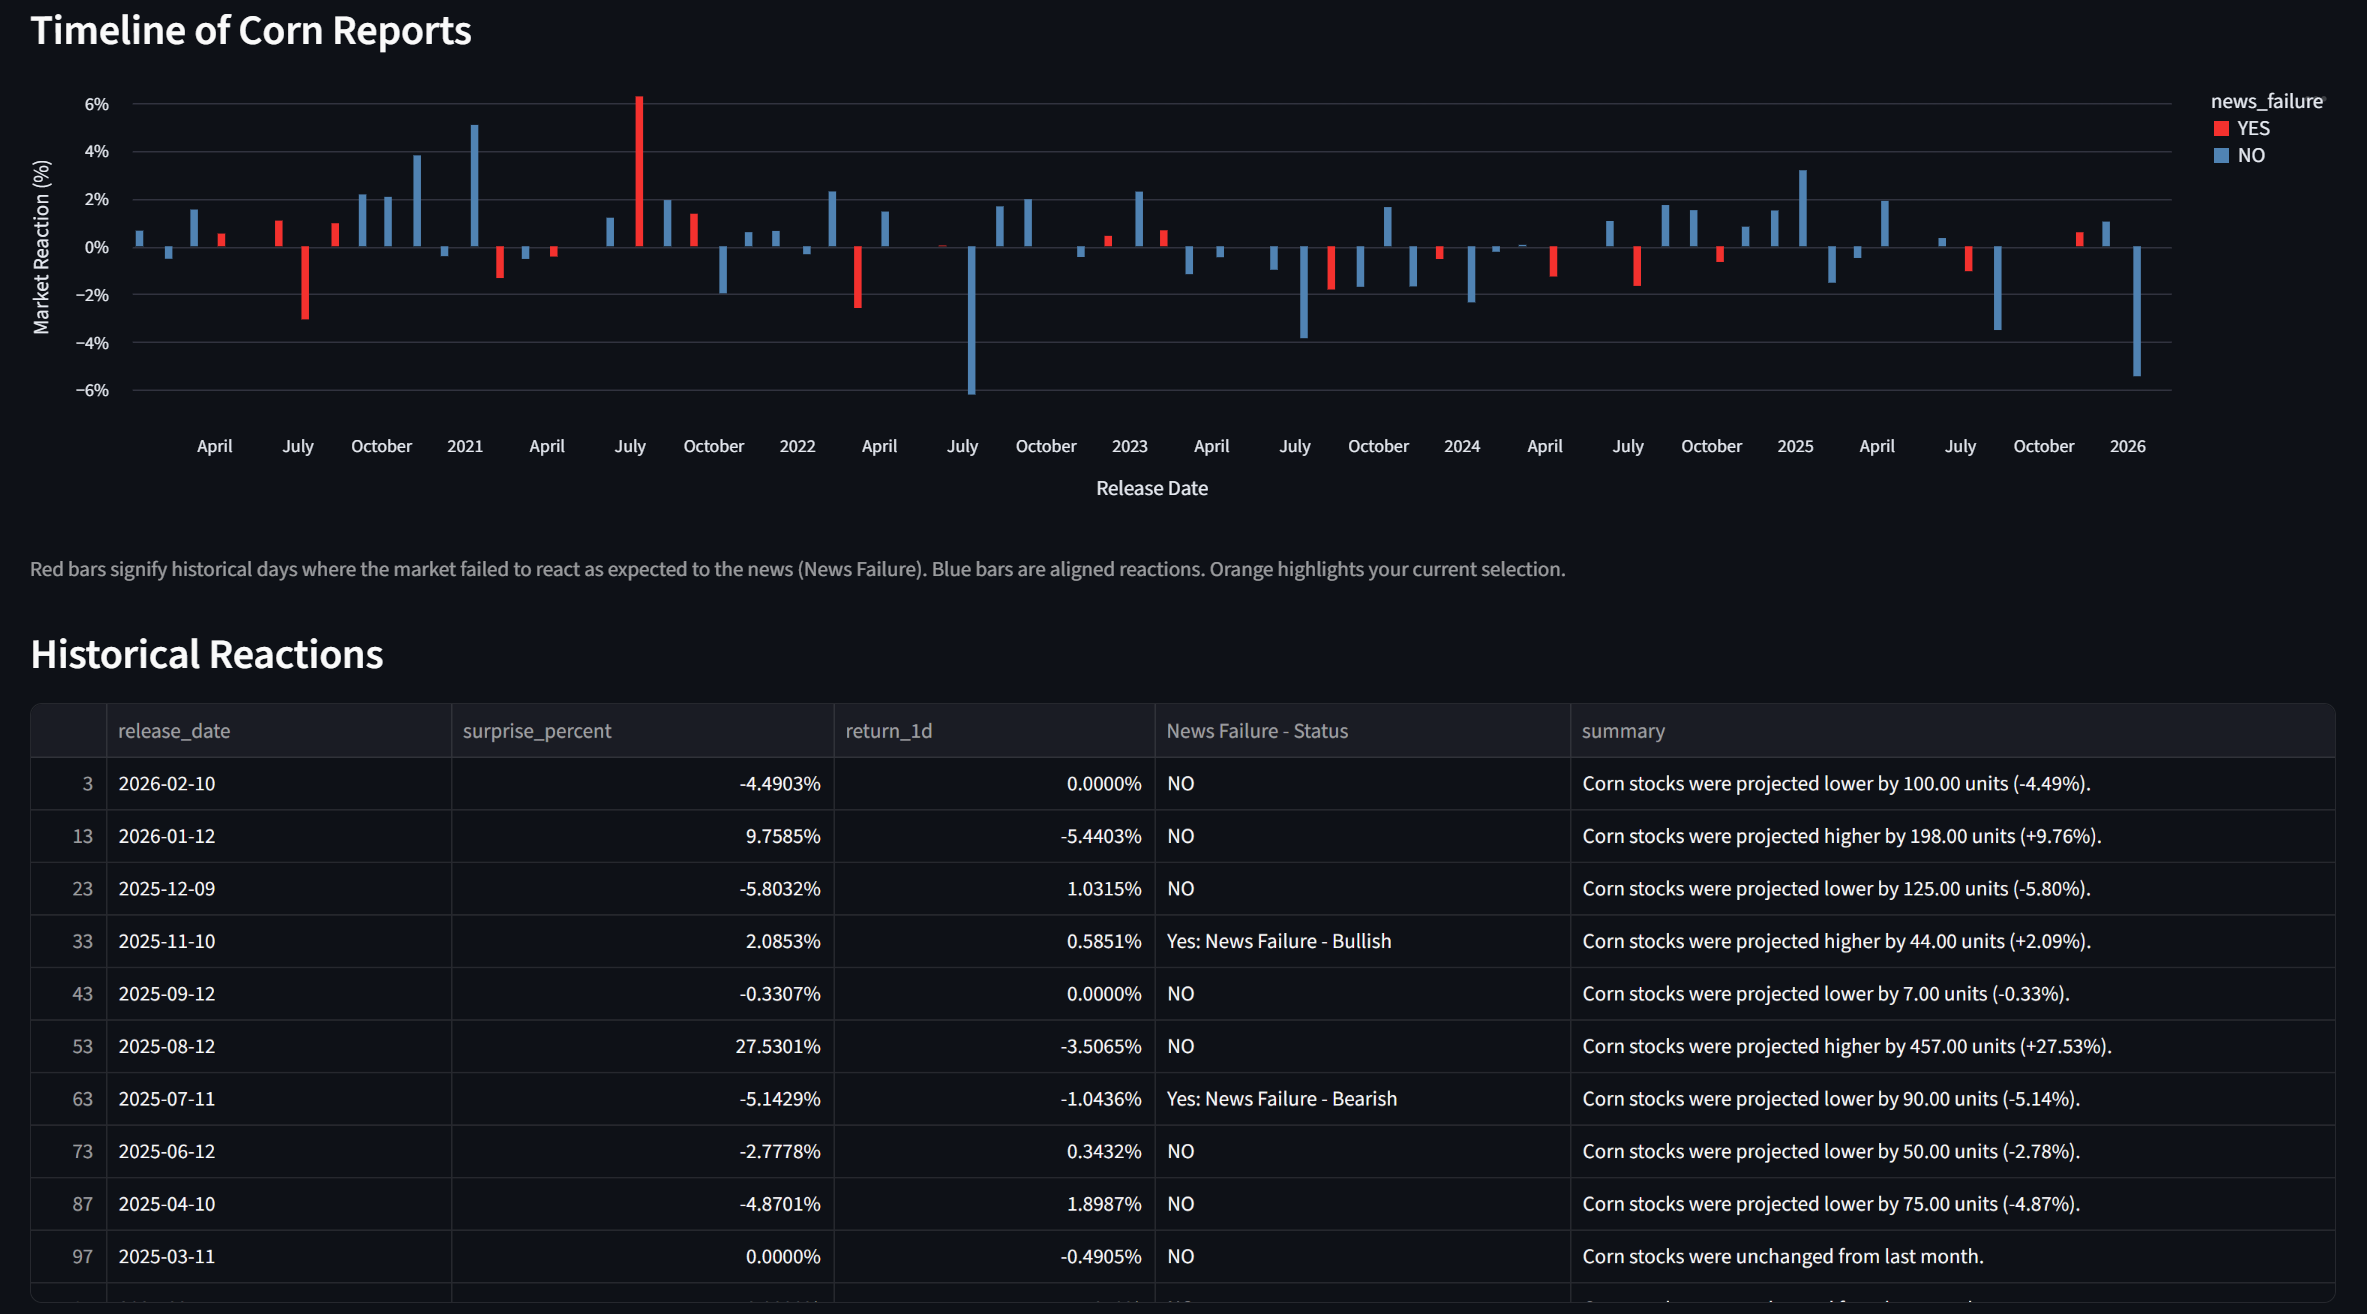
Market Reaction Measurement
For each data release, we measure the 1-day price return: the close on the release day vs. the close on the prior trading day. This captures the immediate market reaction to the news surprise, isolating the signal from broader market noise.
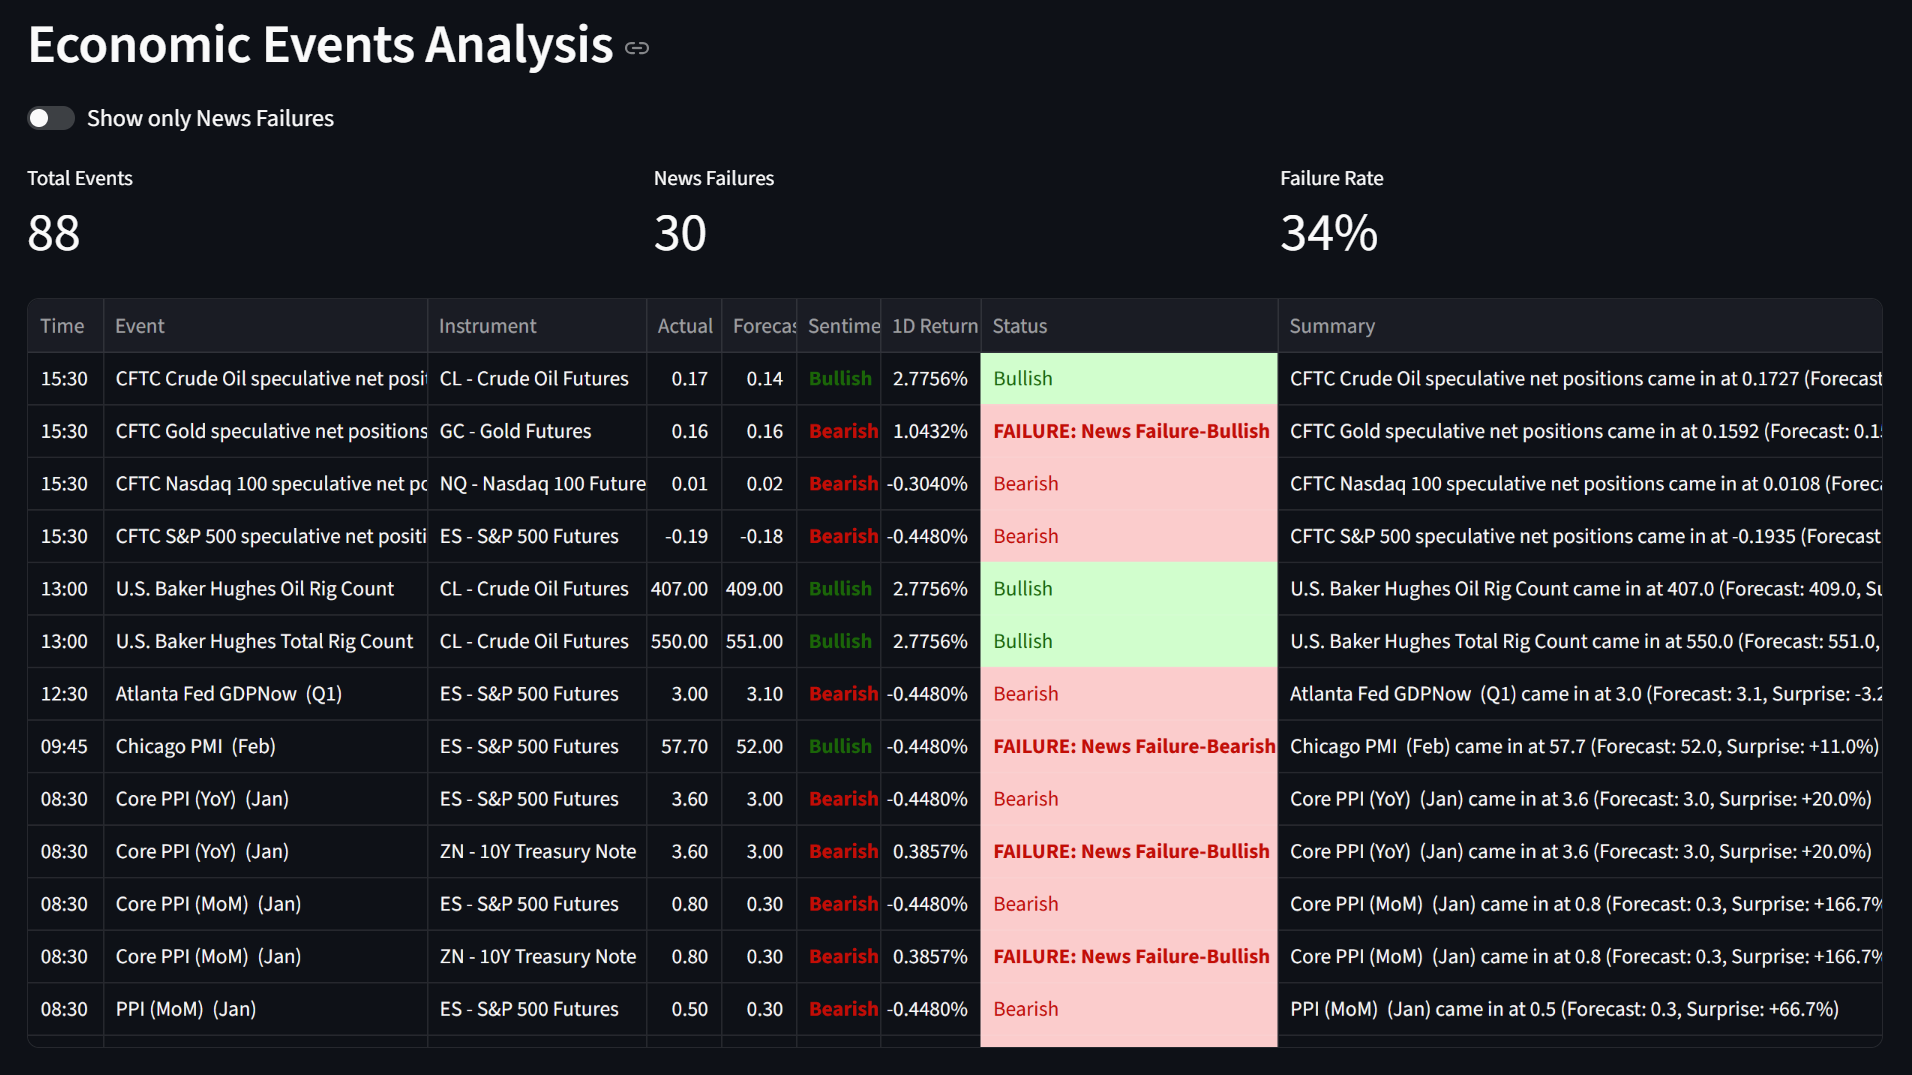
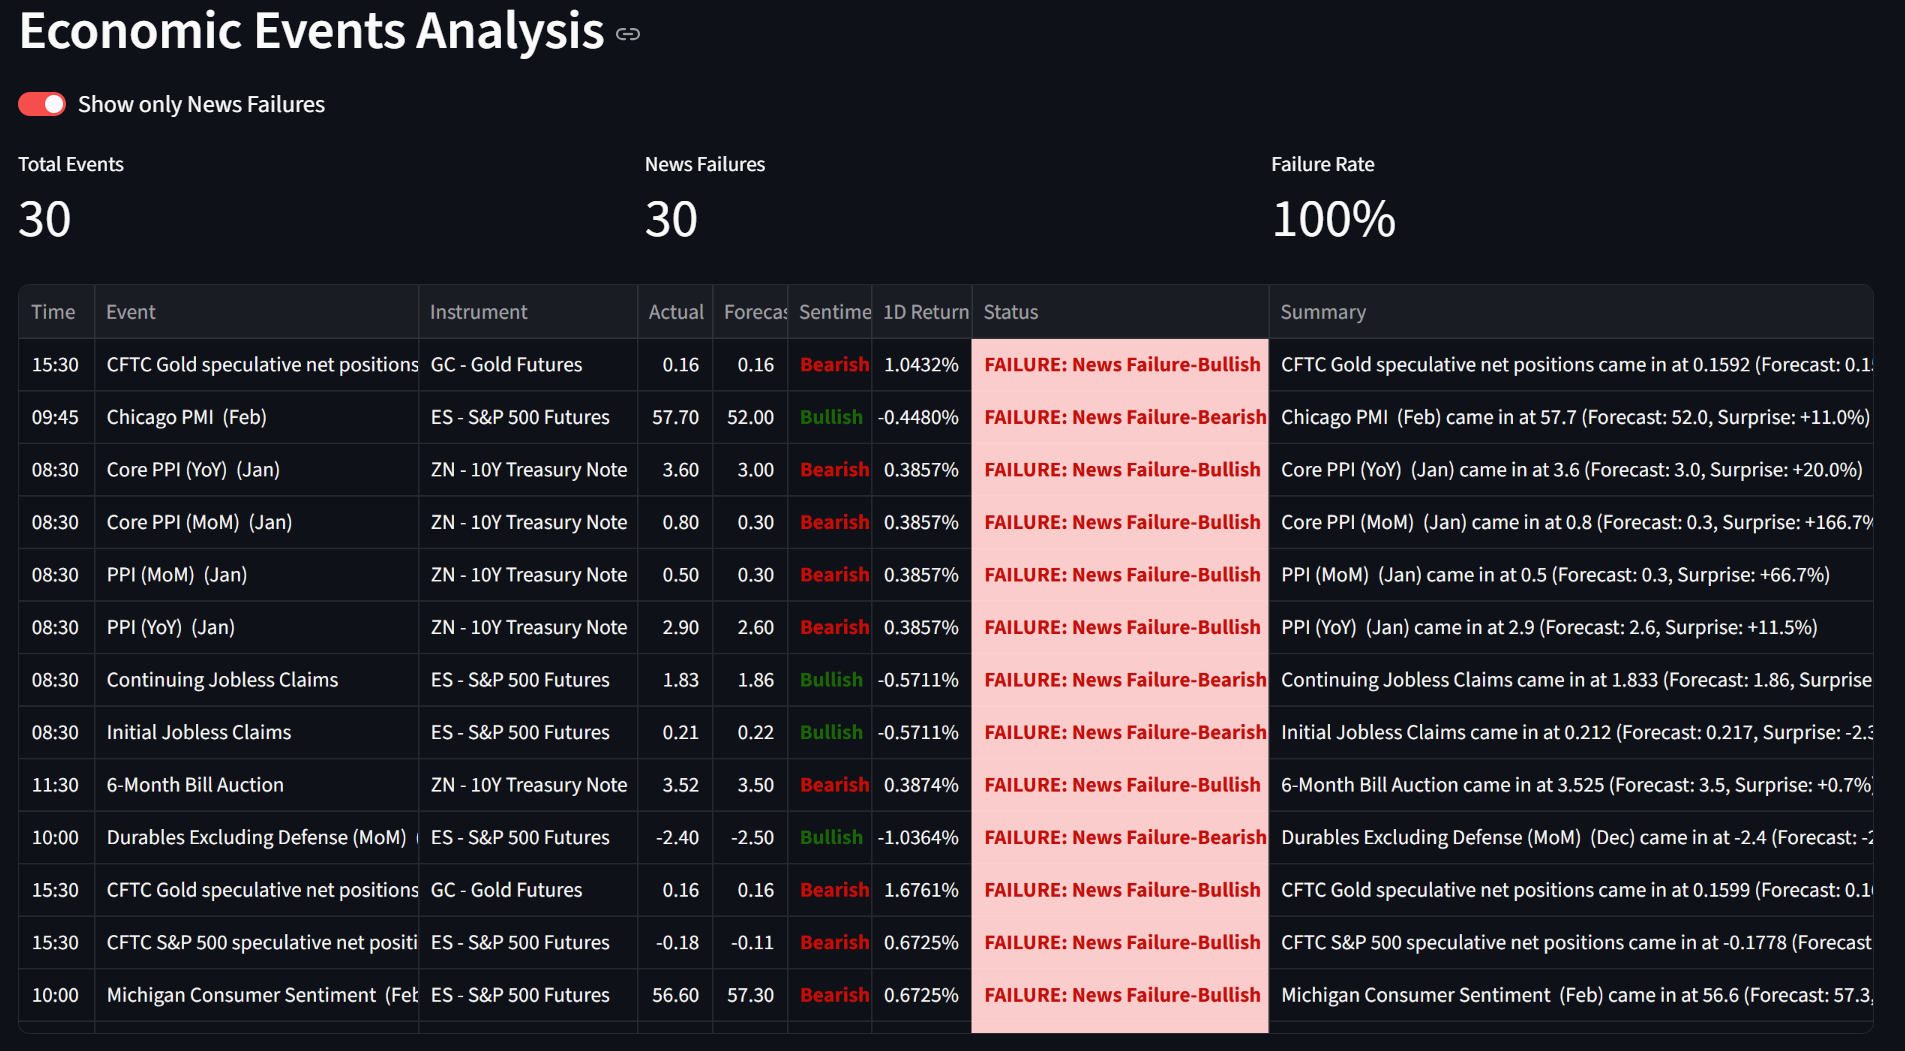
News Failure Detection
The core algorithm: if the news surprise is bullish (e.g., lower ending stocks) but the 1-day return is negative, that's a "News Failure - Bearish." If the surprise is bearish but prices rally, that's a "News Failure - Bullish." A 0.1% threshold filters out noise. These anomalies often signal that larger forces are at work.
Real-time Monitoring
During market hours (12:00 PM - 4:00 PM ET on WASDE days), the monitor polls live prices every 2 seconds and recalculates failure statuses. The dashboard refreshes every 60 seconds, showing you which instruments are currently in a News Failure state with live price data.
Signal Delivery
News Failures are surfaced on the live dashboard with full context: the data surprise, price reaction, sentiment classification, and a natural language summary. Historical patterns are available for backtesting. The platform runs 24/7 with automatic scheduling for WASDE days and daily economic refreshes.